If reading long blog posts online isn’t your thing, this entire post can be downloaded as a formatted pdf.
What Is Marketing Attribution?
In the context of digital marketing, marketing attribution is a math problem for assigning recognition of an outcome to an action. For marketers in a B2B context, the outcome is probably a lead and the action is the marketing channel that led to conversion.
The purposes of marketing attribution and corresponding analysis are to understand the contribution marketing actions make to an end-goal, to optimize the overall marketing mix and to make better decisions – like lowering the cost of acquisition for increased efficiency.
Ground Rules
Attribution is complex and sophisticated. With an entire industry dedicated to understanding and managing its nuance. It also assumes your marketing systems are integrated, validated and accurate. It will take time to put all the pieces together, build your framework, gather data, analyze results and understand how everything fits together. Do not despair. Attribution is a journey, not an event.
Framework
Marketing attribution is complex and warrants a broad framework to keep things organized. Identify a goal then build out a system to track and evaluate performance. In our example of a B2B startup, we’ll focus on leads and look at a simple framework to illustrate. The goal can be abstract like “demand” or concrete like new customers. Just make sure the business is aligned internally so everyone is working with the same definition.
We’ll define a “lead” as someone who’s successfully completed a conversion event and been added to the Customer Relationship Management Database (CRM). Our framework is derived from the marketing funnel and includes metrics, by online and offline channels:
- Impressions
- Clicks
- Click through rate (CTR)
- Cost per click (CPC)
- Website traffic (users)
- New website traffic (new users)
- Leads
- Conversion Rate (CVR)
- Cost
- Cost per lead (CPL)
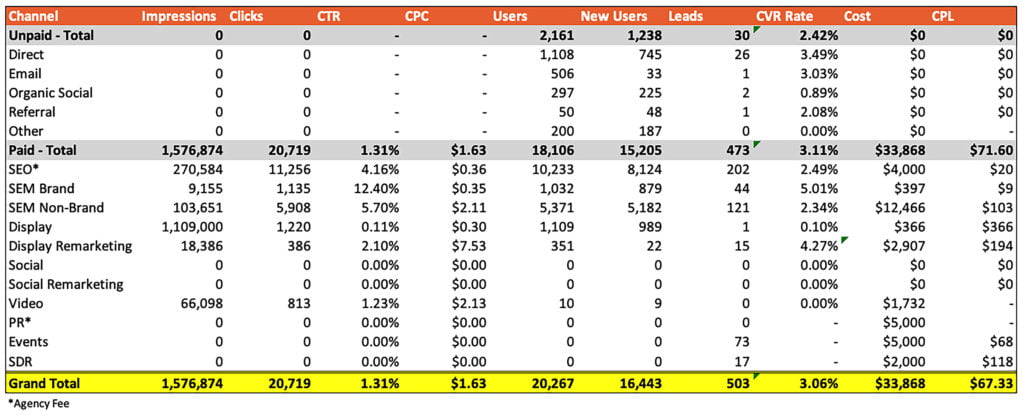
An example dashboard might look like:
Notes:
- Marketing actions are executed digitally and physically. Not everything can be tracked and there will be gaps.
- Each marketing channel has its own optimization framework. A high-level look should include metrics that apply to the most possible tactics.
- Don’t be surprised if data has large variances at the start. It will improve over time.
- It’s important to understand the nuance of each marketing channel – its purpose, how it contributes to a complete marketing funnel, how it influences other channels. Some marketing channels must be evaluated in relation to overall strategy rather than pure numbers.
- For many companies “SEO” is categorized as “unpaid.” However, since there’s often outside help (agencies or freelancers) we prefer to place it under “paid” to account for necessary fees and to calculate a more correct cost per lead.
The dashboard contains the number of leads (the goal) generated by each marketing channel. This is attribution. In this table, referral traffic brought one lead, SEO had 202, SEM Non-Brand 121, etc.
And, because spending is tracked too, each marketing channel has a “cost per” number that illustrates the overall efficiency relative to the goal.
Congratulations, you’ve completed your first attribution exercise and answered the questions: what channels are generating leads, how many and at what cost? Pat yourself on the back.
What does it all mean?
This is where things begin to get complicated. Looking at the above data, a few questions stand out:
- Does this mean we’re done with attribution?
- Where did the data come from? Can it be trusted?
- Some channels are really efficient and others definitely not. Should we put our entire investment into the most efficient channels and stop everything else?
Does this mean we’re done with attribution?
Both marketing engines (like Google Ads) and analytics platforms (Google Analytics, Omniture) have free attribution tools available. However, without action the systems are not aligned or defined. To be useful, a number of fundamental questions must be answered by the business team and the tools must be programmed to reflect those decisions.
The complexity and nuance of attribution mean there’s rarely a point where it’s “complete.” It’s a continual process of learning, iteration, analysis and improvement. Further, slicing and dicing data always leads to new questions.
Where did the data come from? Can it be trusted?
Data sourcing is interesting because systems record behavior and actions differently. The result is cross-platform inconsistency and, even after platforms are integrated, validated and deemed “accurate,” you’ll find variance between expected and actual results. This is normal behavior. Systems record and share data in different ways. Plus, there’s a natural drop off as users move down the funnel like when user clicks an ad but closes the window before the analytics tag fires to record the visit.
Below is the earlier table with data sources in place of numbers:
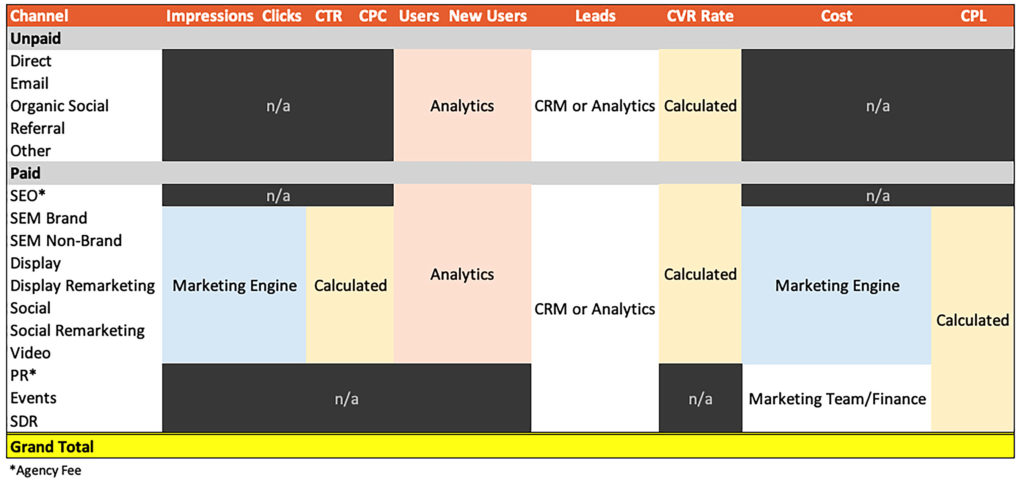
Notice the leads column says “CRM or Analytics.” Certain metrics are recorded in multiple systems so you need to choose which to use. Which you choose is less important than making sure you always use the same one. This consistency ensures you’re always comparing apples to apples and simplifies troubleshooting when necessary.
Also note this is simplified to highlight paid channels. Non-paid marketing tactics like email do have “impressions” (sends), clicks and CTR but, outside of cost accounting, no CPC, cost or CPL. Same for organic social and others.
Some channels are really efficient and others definitely not. Should we put our entire investment into the most efficient channels and drop everything else?
That’s expected and no, don’t drop everything else; each marketing channel serves a different purpose and functions at different levels of the funnel. Marketing actions support one another sometimes in hidden ways. The deeper realization of attribution is quantifying each channel’s contribution to an action to understand the total effectiveness of a marketing program.
For example – display and video are two of the most inefficient marketing channels on a direct cost/per lead basis. Does that mean they should be ignored? Definitely not! Conversion is not their purpose. They are awareness vehicles – designed to fill the top of the funnel – and support conversion (leads) by generating awareness (demand).
As part of a complete marketing program, inefficiencies in one channel are balanced by hyper-efficiencies in others. They work in concert. As a program develops, individual channel goals can be divined. (More later but note: analytics suites usually include a “multi-touch attribution” tool that captures all channels that led to a conversion. Display and video are generally found in the early part of this journey and often get zero credit.)
To answer the question: No, don’t jettison all but the most efficient activities because you’ll end up missing a lot of opportunity. Over time, you’ll quantifiably evaluate each channel’s impact and make decisions on where to invest. Endeavor to understand the purpose of each channel, monitor its performance, measure its impact and understand how they work together. Soon, you’ll uncover how seemingly unrelated things (PR and organic search; video and social; paid search and banners) do, in fact, work together.
Fine Tuning Marketing Attribution & Understanding Your Full Marketing Mix
All analytics platforms have proprietary tools and methods of recording conversions and attributing them to sources (i.e. marketing channels). There are also full marketing attribution solutions available for purchase. Regardless of how you choose to proceed, here are some basic principles to keep in mind.
Touches
A “touch” is when a user engages with a marketing tactic. Click on a search ad: touch; click on a display banner: touch; click an email link: touch. Marketing attribution models assign value to each touch.
A simple model might look at only the last touch – the one that actually led to the conversion. Other times it’s better to focus on the touch that brought a user to your website (first touch). More complex models look at every touch, specific touches, certain touches. The option you choose should reflect the specifics of your business, conversion funnel, and process. Typical “touch” models are:
- First Touch – the first vehicle a user touched that led to a conversion.
- Last Touch – the last vehicle a user touched that led to a conversion.
- Last non-direct touch – the last non “direct” vehicle a user touched that led to conversion. Direct being a user typing the url directly into their web browser.
- First non-direct touch – the first non “direct” vehicle a user touched that led to conversion. Direct being a user typing the url directly into their web browser.
- Linear – all vehicles touched that led to conversion get equal credit for the conversion.
- Time decay – Similar to linear in that all channels that led to a conversion get credit but, the amount of credit is adjusted by timing. A touch two weeks before conversion receives less credit than a touch that happened the day before conversion.
- Position based – Marketing vehicles get varying degrees of credit for the conversion based on where in the funnel the touch happened. First and last touches generally get more credit than those in between.
- Custom – An advanced model, defined specifically by your team specifically for your business.
Each model opens a unique window into the efficacy of your marketing program, which is why the model needs to reflect the business. It’s also a reflection of your businesses approach – which elements of marketing your team believes should be emphasized.
Marketing Attribution Windows
Just as important as what led to conversion (touches) is the time when a conversion happens. In some cases it’s prudent to grant a marketing action credit (for conversion) three-months after it happened. In other scenarios, looking beyond a 1-day window makes no sense.
There’s no ‘right’ window. It’s dependent on the product, business model and your team’s marketing program. For example, an FMCG e-tailor might prefer a 1- or 3-day window because a consumer is making a purchase decision in real time and looking back further muddies the waters. On the opposite end of the spectrum, a Fortune 500 enterprise selling large B2B software solutions might choose a 90-day window to capture a more complete picture of their marketing efforts.
If enough data is available, it’s best to make a data-based decision when choosing a marketing attribution window. Analysis can identify the typical conversion time for your process which influences how you view attribution timeframes. It’s also worth exploring whether all channels use the same window or if each channel should be considered independently and have unique attribution windows. For example – paid search over a 7-day window, display banners at 1-day, social remarketing at 30-day.
Some standard marketing attribution windows are:
- 1-day
- 3- day
- 7-day
- 30-day
- 90-day
Marketing attribution windows are often overlooked when building a model though it is essential to its effectiveness.
View-Through Conversions
Important to note that an “engagement” is not the only way to influence a conversion and there are cases where examining other methods of influence are important.
In digital marketing, channels that get relatively little engagement like video advertising often have difficulty advocating for budget in a performance-driven world. As a way of illustrating their value, ad networks introduced the concept of “view-through” conversions.
In this framework, value is assigned based on influence, not engagement. Consider the funny cat video you watched on YouTube this morning and the pre-roll video ad you were forced to watch beforehand. Did you click? Doubt it. But, you saw the ad and it had some impact – positive or negative – on your decision to make a purchase with the vendor. If, later on, you returned to the website through a search engine and made a purchase (assuming systems are integrated), YouTube will identify the view, the purchase and then allocate some credit to the ad as a “view-through conversion.”
Though more challenging to attribute, this logic applies to non-digital channels as well. For instance, a potential customer visits your event booth and shares no personal info. Two weeks later the same person visits your website and schedules a demo. A standard model would attribute the conversion to “direct” (i.e. no marketing channel) when, in fact, the event booth should get the credit. If your systems have a view-through conversion-type capability built out, when the lead enters your sales CRM and the Sales Development Representative (SDR) team notes their event attendance, data will sync and in the next periodic report, the event should get some credit.
Cool huh? At this point, it’s best to just know this is out there and something to consider incorporating into a broader, more sophisticated marketing attribution strategy later. Solutions that take these into account get complicated so it’s best to set this up with the help of a professional.
Cross-Device
Similar in complexity and difficulty to view-through conversion attribution is cross-device conversion attribution.
Cross-device marketing attribution attempts to capture and quantify the multi-device reality we all live in. Often folks have multiple personal and professional devices and don’t limit browsing habits to a single one. Browsing behavior is captured in sessions on individual devices. Cookies allow systems to attribute actions across multiple sessions (visits to a website) on a single device in a single browser. Cross-device attribution attempts to stitch everything together.
Consider this scenario: Sarah travels to a conference, discovers a great new product and visits the website through a paid search ad (SEM) on her personal phone. That evening, back at the hotel, she checks out the website on her work laptop (direct – typing the URL into the browser). Monday, in the office and using a desktop PC, Sarah does a search (she forgot the URL), clicks through the organic result (SEO) and continues her research. That evening at home she shows her husband the website on their personal tablet (via paid search query – SEM – again forgetting the URL). A week later, on her desktop at work, having forgotten all about the great new product, she sees a banner ad (remarketing), clicks and schedules a demo.
Which marketing channel gets attributed with the conversion?
Assuming a long attribution window: in a last-click model the remarketing banner gets credit while in a first-touch model paid search (SEM) gets credited. However, neither option captures the totality of marketing actions that influenced conversion. Which, as a marketer and business leader, is the goal of marketing attribution.
In this example, the marketing channels that influenced the conversion are: the event, SEM, direct, organic search (SEO), remarketing banners. The devices used are: personal mobile phone, work laptop, work desktop and personal tablet – a lot of marketing channels and devices.
Cross-device attribution attempts to create a single user profile (Sarah’s), across all devices and browsers, to understand the complete customer journey. Backend configuration is required and any solution assumes identifying information is not being blocked – cookies, device IDs, logged-in accounts, etc.
This is part of an expert-level marketing attribution model. It is however, one of the great challenges in all digital marketing and attribution.
Upleveling Your Marketing With Attribution
Attribution is knowledge. It’s information to help marketers and business leaders make decisions based on the actual relationship between investment and return. This series of posts uses the goal of leads and cost per lead vis a vis marketing attribution. They could just as easily be total revenue, ROAS, ROI or any other preferred metric.
When actual numbers are tracked on an ongoing basis, they provide a running snapshot of your marketing program which can be used for future-planning. Actual results can also be extrapolated to project (expected) results for any scenario – adding new marketing channels, scaling budget, rightsizing the mix.
For example, your yearly budget allocation meeting is scheduled for next week and you’ve done a great job (illustrated in example tables in earlier posts). Considering overall efficiency is strong you want to increase budget next year. Hard data generated from past performance will strengthen your logical, data-based argument for the increase. Let’s examine how this might play out.
Recall, this table from earlier:

Which can be edited and reformatted to highlight by channel contributions:
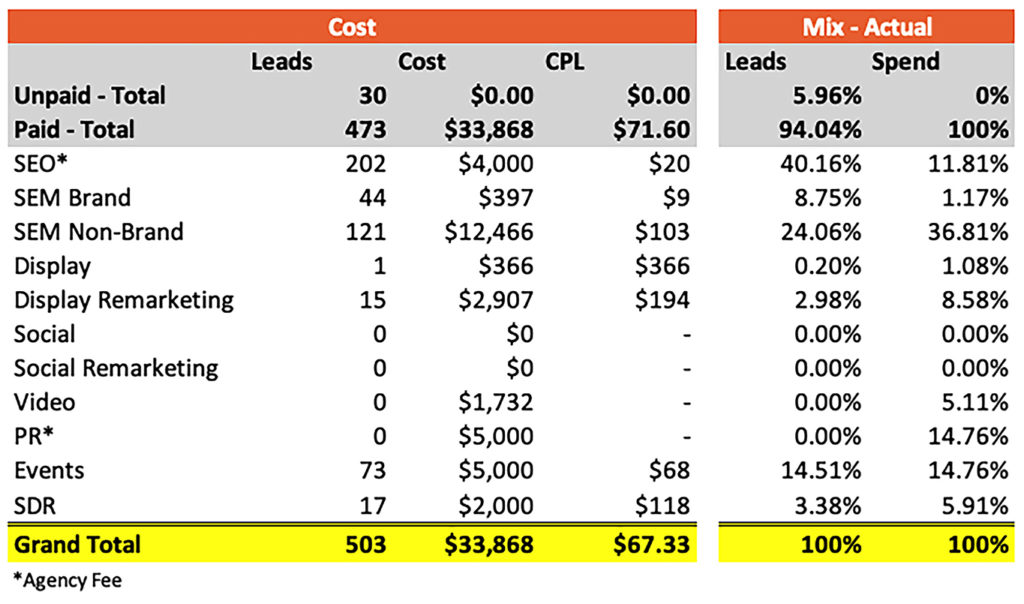
Essentially, contribution amounts illustrate the relative performance of each channel to spend – SEO is almost 12% of the budget and responsible for 40% of leads; non-branded paid search is 36% of the budget yet drives only 24% of leads. Marketing attribution helps make informed future-forward decisions like ‘is the amount being spent aligned with what it generates and broader business goals’?
In preparation for the budget meeting, you’ll prepare two proposals: one version with your ideal, increased budget and a second with a stable budget for comparison.
Notes:
- Assume data is using a simple 30-day last touch model (B2B sales cycles are long)
- Understand the purpose of each marketing vehicle and keep “non” or “under-performing” channels in consideration even when contribution analysis might suggest pausing
- Due to scaling challenges and fixed costs, increasing budgets need to be spread across other channels
- Specific considerations for scaling budget
- Certain vehicles like SEM and remarketing are limited – by demand or audience – and cannot scale uninhibitedly
- Branded search, for example, often maxes out on inventory because there’s only so many people searching for your product/company by name
- Additional non-brand search terms, on the other hand, can usually always be found though with decreased efficiency
- Secondary channels like remarketing are limited by the audience available. Scaling up requires additional marketing to build those audiences through other means first
- Certain fixed cost tactics like PR or SEO can be scaled via additional support or services. Others, like events, are set and have limited flexibility.
- Testing new channels – social + social remarketing, radio (terrestrial & digital), TV, OOH, content syndication, referral, direct mail – is a great way to reward earlier successes and to support scaling.
- Use estimates when historical data is not available
- Leverage past experience with those channels along with actual results from other tactics when estimating
- Certain vehicles like SEM and remarketing are limited – by demand or audience – and cannot scale uninhibitedly
The Budget Ask
Proposal 1
Let’s first examine what this might look like in a relatively stable budget scenario. Start with actual results to get a lay of the land. Then, build another table and start inputting projected numbers starting with known costs like agency fees.
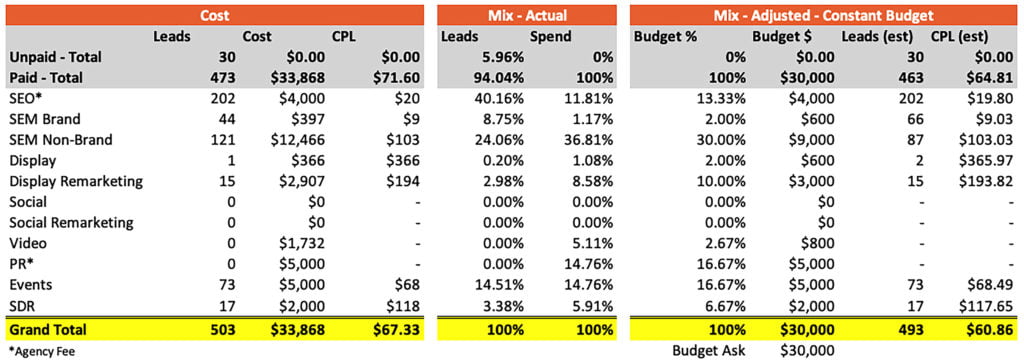
Next, start aligning projected budget contribution to actual lead contribution where possible and where it makes sense. For example, “actual” spend for SEM brand is 1.17% of budget and 8.75% of leads with a $9 CPL. It would be great to increase budget but that’s probably not possible because only so many people are searching for your brand as of right now. Therefore, the actual dollar amount should be relatively consistent. On the flip side, SEO (11.81% of budget and 40% of leads) might deserve more spend because it’s performing well. So, you go back to the agency and ask if they have additional tools/services and if more budget would yield more efficiency.
Work through budget percentages, actual dollars, and CPL estimates until all percentages equal one hundred and the budget sums to your goal. Finally, does it pass the smell test?
Proposal 2
Marketing attribution and reporting are the foundation of any plan when advocating for additional budget. When looking to scale, follow a similar procedure as above with additional considerations like testing new channels when current ones aren’t enough. Building off the earlier proposal, what might it look like if budget went from $30k to $50k:
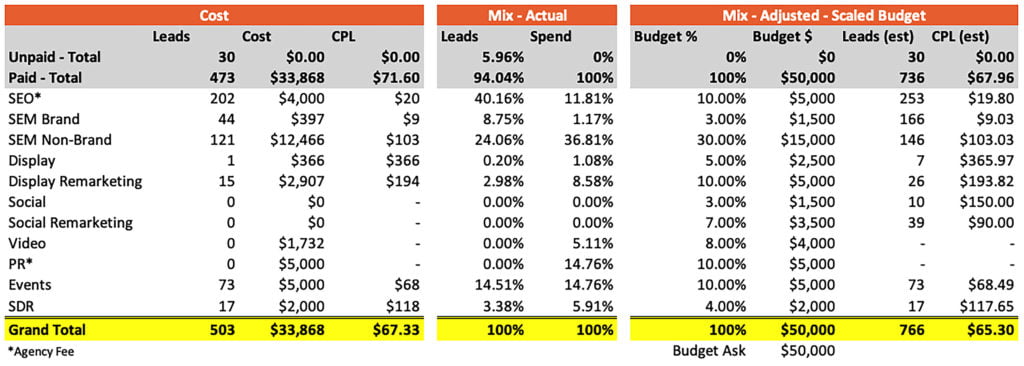
Note, as budget increases, its contribution relative to fixed costs decreases. Coupled with inventory limitations in channels like branded search and remarketing, two options are available for increasing budget:
- Introduce new channels
- Estimate CPL based on experience and historical data from other channels
- Massage contribution percentages to ensure the total sums to one hundred percent
- Scale existing channels with unlimited inventory like display and accept decreasing efficiency (i.e. higher acquisition cost)
Depending on the situation, either or both might make sense. In this example, we’ve done a bit of both:
- Introduce new channels: Notice two new rows: social and social remarketing. Both under the assumption they exhibit greater efficiency than other awareness-type activities like display banners. Both CPL estimates and budget contribution percentages should take these into account as well.
- Scale existing channels: Display banners and video generate awareness and fill the top of the funnel. The resulting traffic becomes ripe for remarketing – which, you’ll notice, also has increased budget.
Voila! You’ve now identified and created a marketing attribution model, applied it to results and generated insight AND used it to advocate for additional budget. Congratulations!
Summing It All Up & Putting It Together
The building blocks of marketing attribution are:
- Systems integration and data validation
- The funnel
- Crediting leads to the marketing channel that caused it
- Understanding how marketing channels interact and work together
- Understanding the purpose of each marketing channel – awareness vs action
- Finding the right model for your business: Touch & Window with bonus points for view-through and cross-device
- Deploying a model that takes all this into account
- Reporting at regular intervals
- Using the model and data to estimate future results and advocate for a position
Once the framework is in place and you’re confident conversions are correctly attributed it’s time to use the data for its intended purpose – making better decisions to optimizing the marketing mix and lowering cost of acquisition.
Then, as you build new dashboards and gather more data your accuracy in anticipating cost, modeling and projecting future performance will improve. As experience builds you might even consider getting in even deeper and start developing your own models!
And finally, remember you can also download this post as a formatted pdf to read and share at your leisure.


