An Always Up-to-date Guide
Updated on 01/21/2026
There is a saying in marketing: “It’s always easier to report when the metrics are good.” This saying rings especially true in the B2B marketing agency world. But how do we know what constitutes “good” metrics? We can certainly call results good or even great if they meet or exceed any previously stated criteria or goals but even then, how do we set those target numbers? The answer to these questions and more is every performance marketer’s best friend, benchmarking.
What are Marketing Benchmarks?
A benchmark in marketing is a standard or point of reference used to measure or compare performance, quality, or progress. It helps evaluate how well something is doing by comparing it to a goal, industry standard, or best practice.
Benchmarking and Relevancy
While benchmarking in marketing is almost always useful, it’s absolutely vital that we select the most relevant benchmarks from reputable sources for setting realistic goals and accurately evaluating performance across paid media, SEO, email, and other marketing channels. Benchmarks provide a clear frame of reference, ensuring your comparisons are grounded in industry standards or best practices rather than arbitrary expectations. Using credible, well-researched data helps avoid misguided strategies, allowing for more effective decision-making and resource allocation. Additionally, benchmarks tailored to your industry, audience, or campaign objectives ensure your goals align with achievable outcomes and provide actionable insights to improve performance.
With that said, there is no lack of B2C advertising benchmarks online, whereas B2B advertising benchmarks are much harder to find. Even the few reputable sources we have found lack important industry segmentation like “SaaS” or “AI/ML solutions” in favor of more service-oriented industries like “industrial services,” “legal,” “finance & insurance,” or really broad categories like “B2B,” or “Technology” (which leans more toward hardware ecommerce). This has revealed that many of the benchmarks that work for ecommerce or service providers, are simply not accurate for deeper tech industries and thus can be misleading.
Given these shortcomings for establishing better B2B advertising benchmarks Firebrand has put together our own set using data from the last 8 years of advertising for technology-based startups and scaleups across Google Paid Search, Display, and LinkedIn Ads.
Benchmarking Dataset and Methodology
When we think of benchmarking, there are typically three sources to be able to compare and contrast performance and guide our goal setting efforts:
Company (Client) historical performance
-
- This is a good starting point for any ad program as this will obviously be the most relevant indicator given the complexity of user behavior and differing levels of brand equity and UX or messaging between advertisers even in the same exact sector with similar spends etc. for example.
Agency aggregated performance
-
- Advertising agency benchmarks allow for more accurate benchmarks segmented further by industry, sector, funding round, ad spend, and more to match up closely with the company attributes.
Platform/Network performance
-
- Overall aggregate benchmarks for Google Ads or LinkedIn as a whole or networks therein like Paid Search or Display and typically sourced from reputable sites like Wordstream or The B2B House.
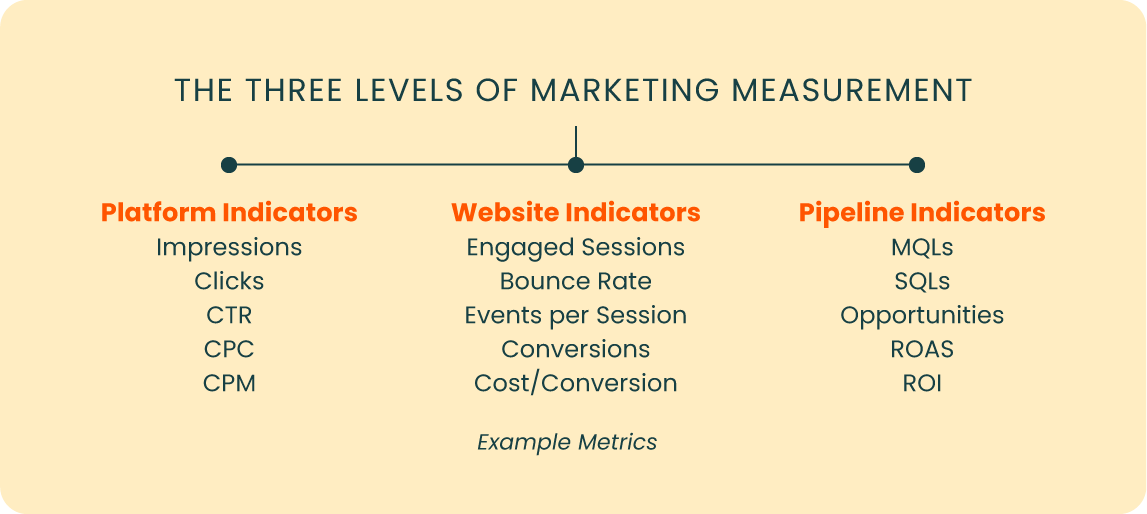
For the following digital advertising benchmarks we will be focused on the first level of marketing measurement (Platform Indicators) because these offer the most parity between advertisers. Once you move into Website Indicators or Pipeline Indicators, benchmarking beyond the Company Source we mentioned above becomes less useful due to the complexity of motions behind user website behavior and sales process respectively.
The Dataset
We have combined monthly performance data from the last 8 years of the most commonly reported on (and useful) advertising metrics as averages. This includes data from Google Paid Search, Google Display, and LinkedIn Ads and has been further qualified to be able to segment into more specific subsets (eg: Sector, Funding Round) so that we can provide you with the most relevant B2B advertising benchmarks that align with your technology and or business.
For each network below we provide benchmarks for each important metric by:
- All-time average: The 8 year average of all client data combined
- 2024 average: The past year’s data for all clients combined
- A reference benchmark via 3rd party (Wordstream) who did a similar analysis
- 2024 average of all our clients data combined, broken down by
- Sector
- Funding Round
- Spend
Paid Search Advertising Benchmarks (B2B/Tech Focused)
Google Paid Search: Click-through Rate Benchmarks (Average)
-
- All sectors/funding rounds/spend
- 5.27% (All-time) [8 year average of Firebrand client’s data]
- 6.82% (Jan 01 – Dec 31, 2024) [Firebrand client’s data]
- 3.17% (All industries via Wordstream) [Another way to compare benchmarks]
- Sectors (2024)
- AI/ML: 7.89%
- Cybersecurity: 7.03%
- Fintech: 6.88%
- HR tech: 7.37%
- Infrastructure: 6.45%
- SaaS: 7.45%
- Funding Round (2024)
- Seed: 4.65%
- A: 5.43%
- B: 12.86%
- C: 6.15%
- Late-stage: 4.50%
- Private: 9.71%
- Spend (2024)
- Low ($1-$6K/month): 6.91%
- Medium ($6-$15K/month): 6.94%
- High ($15K+/month): 6.57%
- All sectors/funding rounds/spend
CTR in Paid Search is affected primarily by the synergy between your keyword targeting and the ad copy in your Search ads. The average CTR for 2024 (6.82%) was 1.55% higher than the average for the past ten years, likely signaling that Google Search Ads are performing better in the past year for generating clicks in the B2B tech space. The avg. CTR was also 3.65% higher than the Wordstream average for all industries which either reflects differences in the effectiveness of Firebrand and Wordstream’s campaigns, or the fact that Wordstream’s average is more B2C or services-oriented so they likely have more congested auctions.
Unsurprisingly, the AI/ML sector had the highest CTR (7.89%) as this is a hot space right now. Funding round B had a very high avg. CTR (12.86%) which is likely skewed by a few top performing clients. Also important to note is that results typically scale up as the funding round increases, which shows that trust grows as brand recognition does. Note that monthly spend does not really change the CTR, being relatively equal from low to high.
Google Paid Search: Cost per Click (CPC) Benchmarks (Average)
-
- All sectors/funding rounds/spend
- $5.63 (All-time)
- $8.86 (Jan 01 – Dec 31, 2024)
- $2.69 (All industries via Wordstream)
- Sectors (2024)
- AI/ML: $6.91
- Cybersecurity: $10.44
- Fintech: $7.73
- HR tech: $14.32
- Infrastructure: $3.15
- SaaS: $15.36
- Funding Round (2024)
- Seed: $14.93
- A: $6.84
- B: $6.18
- C: $7.75
- Late-stage: $7.01
- Private Equity: $6.45
- Spend (2024)
- Low ($1-$6K/month): $12.55
- Medium ($6-$15K/month): $4.63
- High ($15K+/month): $9.57
- All sectors/funding rounds/spend
CPC in Paid Search is affected primarily by keyword targeting choices (higher intent keywords with more search volume tend to be more expensive) and Quality Score. The avg. CPC in 2024 was 57% more expensive than our 8-year agency average, which illustrates the overall rise in cost for running Paid Search. Our avg. CPC in 2024 ($8.86) is significantly higher than Wordstream, which ultimately shows the issues with using benchmarks from that and similar sites for getting an accurate B2B tech benchmark — as outlined in the beginning of this article. Because B2B tech deals are worth more money than an ecommerce conversion or services contract, the relevant keywords tend to be more expensive overall.
The SaaS sector had the highest CPC, which could be due to the fact that their contracts are especially valuable as they are recurring and CAC can be defrayed over a longer period, driving up the competition for these keywords. Lastly, seed funding round had the most expensive avg. CPC, which probably shows that advertisers just starting out in their business journey don’t have the website collateral in place to achieve a high Quality Scores and need to invest in custom landing pages with targeted keywords present and stronger CTAs to improve engagement rates — which Google considers when assigning a Quality Score. Seed round companies also often target established sectors with high CPC/high volume keywords, so often need to win attention in paid search to drive high-intent traffic. Later-stage companies with mature ad programs have a larger keyword portfolio they know will convert, which brings down avg. CPC.
Google Paid Search: Conversion Rate Benchmarks (Average)
-
- All sectors/funding rounds/spend
- 3.72% (All-time)
- 1.42% (Jan 01 – Dec 31, 2024)
- 3.75% (All industries via Wordstream)
- Sectors (2024)
- AI/ML: 4.18%
- Cybersecurity: 1.78%
- Fintech: 1.23%
- HR tech: 4.00%
- Infrastructure: 3.07%
- SaaS: 1.89%
- Funding Round (2024)
- Seed: 1.72%
- A: 1.90%
- B: 6.66%
- C: 2.65%
- Late-stage: 2.06%
- Private Equity: 1.87%
- Spend (2024)
- Low ($1-$6K/month): 3.13%
- Medium ($6-$15K/month): 2.69%
- High ($15K+/month): 1.42%
- All sectors/funding rounds/spend
Conversion rate in Paid Search is affected primarily by keyword relevancy and a strong alignment between the ad copy and the landing page experience/offer. Given that the avg. conversion rate for 2024 (1.42%) was 2.3 points lower than the 8-year average, could we be seeing some fatigue from asking searchers to submit their information on a form in exchange for a piece of content or demo? Maybe more content in the B2B tech space should be ungated? Keep in mind that conversion rate differs greatly based on your conversion tracking method because if you count micro conversions (like page views) instead of just macro conversions (form fills) you are going to artificially inflate that number (we only count macro conversions in the data above).
AI/ML and HR tech had the highest avg. conversion rates in 2024 as we have seen high demand for gated content in both of those sectors — especially AI/ML.
In general, the conversion rate on paid search tends to decrease as monthly ad spend increases. This might reflect a broader set of keywords which are less aligned with conversion, and more aimed at capturing mindshare/awareness. Larger ad spend campaigns often feature competitive conquesting programs, which can have a high CPC and lower conversion rate, dragging down the mean (but still valuable in their own right).
Google Paid Search: Cost per Conversion (Average)
-
- All sectors/funding rounds/spend
- $472 (All-time)
- $986 (Jan 01 – Dec 31, 2024)
- $48.96 (All industries via Wordstream)
- Sectors (2024)
- AI/ML: $802
- Cybersecurity: $1,101
- Fintech: $1,738
- HR tech: $1,247
- Infrastructure: $734
- SaaS: $1,267
- Funding Round (2024)
- Seed: $1,323
- A: $754
- B: $688
- C: $473
- Late-stage: $2,318
- Private Equity: $362
- Spend (2024)
- Low ($1-$6K/month): $969
- Medium ($6-$15K/month): $258
- High ($15K+/month): $1,868
- All sectors/funding rounds/spend
Cost per conversion in Paid Search is affected primarily by keyword targeting choices (higher intent keywords with more search volume tend to be more expensive) and the strength of your offer (CTA) on given landing pages and the site in general (again, all our conversions are macro aka form fill leads). Here, we’re seeing similar increases to the avg. cost per conversion in 2024, which was 109% higher than the 8-year average. This makes sense, as more B2B tech companies are in the auctions than 5-10 years ago. The Wordstream all industries average is unrealistically low for B2B tech advertisers, again showing the need to find the most relevant benchmarks for your business.
Late-stage funding round had the highest avg. cost per conversion with $2,318 which may be due to the fact that companies that make it this far tend to invest a lot more ad spend into awareness or creative campaigns as opposed to pure lead generation, which skews this metric to the higher side unless you can isolate the results by campaign grouping intent. We tend to advise clients in earlier stages that they also need to invest in awareness campaigns despite their urgency for generating leads.
Paid Search leads are high-intent but come with a relatively high Cost per conversion. These leads represent a high level of investment and should be nurtured carefully. For example, it is not best practice to auto-MQL a lead from paid search.
Display Advertising Benchmarks (B2B/Tech Focused)
Google Display: Click-through Rate Benchmarks (Average)
-
- All sectors/funding rounds/spend
- 0.95% (All-time) [8-year average of Firebrand client’s data]
- 2.16% (Jan 01 – Dec 31, 2024) [Firebrand client’s data]
- 0.46% (All industries via Wordstream) [Another way to compare benchmarks]
- Sectors (2024)
- AI/ML: 0.57%
- Cybersecurity: 5.43%
- Fintech: 2.25%
- HR tech: 1.89%
- Infrastructure: 1.37%
- SaaS: 0.87%
- Funding Round (2024)
- Seed: 0.58%
- A: 0.95%
- B: 0.57%
- C: 2.79%
- Late-stage: 2.46%
- Private Equity: 1.53%
- Spend (2024)
- Low ($1-$6K/month): 0.86%
- Medium ($6-$15K/month): 1.27%
- High ($15K+/month): 4.78%
- All sectors/funding rounds/spend
CTR in Display is affected primarily by the synergy between your audience targeting and the messaging and/or creative in your ad creative. Our avg. CTR for 2024 checks in at 1.21 percentage points higher than our 8-year agency average, which shows that with good targeting and creative, Display can generate meaningful traffic for B2B tech advertisers.
The Cybersecurity sector comes in with the highest avg. CTR (5.43%), which we think is due to lots of very granular keywords (used in custom intent Display audiences) and other targeting mechanisms that allow for more hyper-targeting. The later funding rounds are seeing higher CTR, most likely due to the trust and brand recognition already established which motivates users to click. High spend level saw the best avg. CTR which is counterintuitive as normally more spend equals more impressions which typically brings down CTR, but perhaps shows that investing a solid amount in Display can translate to traffic.
It is notable that the AI/ML sector has a relatively low CTR on Display but a high CTR on paid search. Perhaps prospects are tuning out the advertising from AI brands, and focusing on education when they search.
Google Display: Cost per Click (CPC) Benchmarks (Average)
-
- All sectors/funding rounds/spend
- $1.22 (All-time)
- $0.84 (Jan 01 – Dec 31, 2024)
- $0.63 (All industries via Wordstream)
- Sectors (2024)
- AI/ML: $0.26
- Cybersecurity: $0.87
- Fintech: $0.67
- HR tech: $0.25
- Infrastructure: $0.71
- SaaS: $1.86
- Funding Round (2024)
- Seed: $1.11
- A: $0.57
- B: $0.26
- C: $0.70
- Late-stage: $0.65
- Private Equity: $3.55
- Spend (2024)
- Low ($1-$6K/month): $0.80
- Medium ($6-$15K/month): $0.95
- High ($15K+/month): $0.64
- All sectors/funding rounds/spend
CPC in Display is affected primarily by the competition among target users in our audience setup. Avg. CPC in 2024 was 45% lower than the 8-year average, perhaps showcasing the continued improvements for advertisers to win cheap clicks from Display for B2B tech brands. The AI/ML sector is seeing very affordable CPC (vs. $6.91 in Paid Search) despite the frenzy in this sector, so it might be a good network to get some affordable traffic.
It’s important to note again that Wordstream’s benchmark of $0.63 is just way too low realistically in the actual B2B tech space. The SaaS sector had the highest CPC ($1.86) again attributed to the crowded space where ROI can be really high when a deal is closed (recurring revenue).
Google Display: Conversion Rate Benchmarks (Average)
-
- All sectors/funding rounds/spend
- 3.01% (All-time)
- 2.45% (Jan 01 – Dec 31, 2024)
- 0.77% (All industries via Wordstream)
- Sectors (2024)
- AI/ML: 0.12%
- Cybersecurity: 0.61%\
- Fintech: 0.76%
- HR tech: 0.77%
- Infrastructure: 2.89%
- SaaS: 2.51%
- Funding Round (2024)
- Seed: 0.16%
- A: 0.26%
- B: 0.12%
- C: 3.78%
- (NOTE: Particularly high performing C round clients are skewing this higher)
- Late-stage: 0.98%
- Private Equity: Unavailable
- Spend (2024)
- Low ($1-$6K/month): 0.27%
- Medium ($6-$15K/month): 3.88%
- High ($15K+/month): 0.86%
- All sectors/funding rounds/spend
Conversion rate in Display is affected primarily by audience targeting choices and strong alignment with the landing page experience/offer. The avg. conversion rate for 2024 was 0.56 points lower than the 8-year average, likely due to more investment in the B2B tech space in this network, driving up CPC and this conversion rate. Firebrand conversion rates for B2B tech are much higher than Wordstream, which is due to differences in industries being benchmarked and somewhat due to our focus on lead generation more so than awareness for clients.
Google Display: Cost per Conversion (Average)
-
- All sectors/funding rounds/spend
- $181 (All-time)
- $71 (Jan 01 – Dec 31, 2024)
- $75.51 (All industries via Wordstream)
- Sectors (2024)
- AI/ML: $65
- Cybersecurity: $122
- Fintech: $149
- HR tech: $18
- Infrastructure: $21
- SaaS: $99
- Funding Round (2024)
- Seed: $96
- A: $26.55
- B: $65
- C: $247
- Late-stage: $117
- Private Equity: $106
- Spend (2024)
- Low ($1-$6K/month): $75
- Medium ($6-$15K/month): $25
- High ($15K+/month): $147
- All sectors/funding rounds/spend
Cost per conversion in Display is affected primarily by audience targeting choices. You have a choice between custom intent (which is lower in the funnel and, thus, more expensive) and affinity (which is higher in the funnel and, thus less expensive). That choice combined with the strength of your offer (CTA) on given landing pages and the site in general (again, all our conversions are macro aka form fill leads) will determine your cost per conversion. The agency avg. cost per conversion in 2024 was $110, lower than the 8-year average, making Display a viable lead generating ad network for B2B tech.
The Fintech sector saw the highest cost per conversion at $149 as users that convert on any Fintech forms are typically highly sought-after decision-makers.
Overall Display leads are more affordable than Paid Search but that advantage tends to be offset by lower lead quality overall. In fact, measures to improve lead quality will reduce the number of leads and drive up the cost per conversion. So implicit in these averages (and in comparison with the Wordstream metric) is an assumption about ‘acceptable lead quality.’ Namely, you can make the cost per conversion look good by including junk leads. Firebrand uses a number of methods and third party tools to prevent low-quality leads being counted in its metrics.
Wrapping Up with B2B Advertising Benchmarks
There you have it, paid media benchmarks for Google Ads that are more accurate for B2B tech advertisers. Remember to take all benchmarks with a grain of salt, as each business has a unique customer profile, Google Ads account setup, conversion tracking configuration, and website experience/CTAs. Still, having these benchmarks to compare your performance is always the best starting point until you can establish specific company (internal) ones to also compare against.
Stay tuned for our LinkedIn advertising benchmarks for B2B tech companies coming soon.
With all of the choices, goals, and numbers, B2B advertising is a carefully crafted science. Firebrand’s digital marketing experts are here to create a strategy that aligns with your biggest business goals and maximize your ad budget.
B2B Advertising Benchmark FAQs
Why does benchmarking for B2B advertising matter?
Benchmarking provides a crucial frame of reference for setting realistic goals and accurately evaluating your advertising performance. Without benchmarks, you’re essentially flying blind – you might meet your internal targets, but have no way to know if those targets were appropriate or if you’re underperforming compared to similar companies in your industry. Good benchmarks help you allocate resources effectively, make data-driven decisions, and avoid misguided strategies based on arbitrary expectations.
Why are most publicly available advertising benchmarks not relevant for B2B tech companies?
Most publicly available benchmarks focus on B2C ecommerce or service-oriented industries rather than technology companies. They often lack important industry segmentation like “SaaS,” “AI/ML,” or “Cybersecurity,” instead grouping everything under broad categories like “Technology” or “B2B.” This makes them misleading for tech companies, as B2B tech deals are typically worth more money, leading to higher CPCs and different conversion patterns than ecommerce or traditional services.
How does Display advertising compare to Paid Search for B2B tech lead generation?
Display advertising offers more affordable leads than Paid Search, with an average cost per conversion of $71 versus $986 for Paid Search in 2024. However, this cost advantage is typically offset by lower overall lead quality. Display ads are excellent for building awareness and reaching prospects earlier in the funnel, while Paid Search captures high-intent users actively looking for solutions, resulting in higher-quality leads despite the higher cost.
How does my funding stage affect my advertising benchmarks?
Funding stage significantly impacts advertising performance. Seed-stage companies often see higher CPCs ($14.93 on Paid Search) due to less developed websites and lower Quality Scores. Companies in Series B and C rounds typically see better performance metrics overall, benefiting from established brand recognition and optimized campaign structures. However, late-stage companies sometimes see higher costs per conversion as they shift focus toward awareness campaigns rather than pure lead generation.
How should I use B2B tech advertising benchmarks to set goals for my advertising campaigns?
Start with these industry benchmarks as a baseline, but remember they’re just one of three important benchmarking sources. Also consider your company’s historical performance (the most relevant indicator) and platform-wide averages. Use benchmarks that align closely with your specific sector, funding round, and spend level. Set goals that are realistic but still push for improvement, and focus on the metrics that matter most to your business objectives, whether that’s lead volume, lead quality, or brand awareness.
Want insights like this delivered right to your inbox? Sign up for our monthly newsletter, The Forge.
About the Author
Alastair Nee is Senior Vice President of Digital Marketing at Firebrand, a B2B tech marketing agency based in the San Francisco Bay Area that helps companies grow through creative, data-driven marketing strategy. With a rare left-brain/right-brain approach, Alastair blends sharp analytics with standout creative instincts to build and scale high-performing growth marketing programs that elevate brand profiles and increases their pipeline using the channels and tactics that work best for B2B tech marketing today: GEO/SEO, AI-enhanced paid media, and advanced analytics.
At Firebrand, Alastair leads a team that partners with some of the most innovative names in tech - from AI/ML and data infrastructure to developer tools and B2B SaaS. Over his 17-year career in tech marketing, he has helped launch and grow dozens of companies, delivering award-winning campaigns recognized by The Communicator Awards and other industry benchmarks.
Alastair is a vocal advocate for modern growth marketing and emerging disciplines like AI-powered marketing technology, AI paid media optimization, and Generative Engine Optimization (GEO). His work lives at the intersection of storytelling and performance - where brand meets demand.
Follow Alastair on LinkedIn or explore his thinking on Firebrand’s blog.

